Measuring climate impact of food choices
Jan Broeze
Wageningen Food & Biobased Research
CGIAR Research Program on Climate Change, Agriculture and Food Security (CCAFS)
Climate impact of food is largely determined by food choices. In the scientific domain the knowledge base of climate impact of food production is still rapidly growing. Based on those insights recommendations for sustainable diets are proposed by e.g. the EAT–Lancet Commission (Willett et al., 2019). For estimating climate impacts of food products use can be made of greenhouse gas (GHG) emission factors for crops, see e.g. Clune et al. (2017) and literature cited by them. However, total GHG emissions associated to a food product should also address the post-harvest emissions and effects of food loss and waste. The Agro-Chain Greenhouse gas Emissions (ACGE) calculator (Broeze et al., 2019) can be helpful for estimating total GHG emissions associated to food that we consume.
This paper explains an approach for estimating GHG emissions associated to a menu as well as to the wasted food. We illustrate this on a practical experiment during the 5th Global Science Conference on Climate-Smart Agriculture, which was held 8-10 October 2019 on Bali, Indonesia.
Estimating GHG emissions of a menu
The emissions associated to a menu is the sum of the emissions per ingredient plus emissions related to storage (think of refrigerator energy usage) and preparation (think of cooking energy use).
Emission per ingredient are estimated in a few steps:
Outline the supply chain (either sorting out the actual supply chain or define a logical chain from a typical sourcing area for that ingredient): transportation distances and modalities, buffer/storage times, either or not refrigerated, and possibly other energy use.
Lookup typical greenhouse emission factor for that crop, produced in the concerning region. If that’s not available, value of a similar crop (or some average for a crop category) may be used.
Estimate losses and waste along the chain (again preferably based on specific data; when not available a fallback option is to use other reasonable estimates).
The total emissions can be calculated through adding up the crop emission factor and emissions due to the post-harvest operations, and correcting for food losses and waste along the chain.
To facilitate these calculations, the ACGE calculator may be used. This reduces the efforts to selecting crop category, production region and inserting chain configuration data. The calculator proposes default emission and loss data, which may be replaced by more specific data when available.
The emission allocated to the total menu can be estimated by weighted (according to the receipt’s ingredients ratios) summation of the ingredient’s GHG emissions. Optionally, frozen or refrigerated storage and cooking energy use induced GHG emissions can be taken into consideration. Especially long-term frozen storage requires significant energy; associated GHG emissions are estimated at typically 0.035 kg CO2-eq. per kg product per day (derived from Ashley et al., 2009, and WRAP, 2010).
GHG emissions associated to Food waste can be estimated through weighing the total volume of waste generated and multiplying the weight by the average emission parameter of the menu. For more accurate estimates, the food waste should be split up into different components/ingredients, so that the total food waste associated emissions can be summed from the individual components. Optionally, emissions due to waste management may be added.
Climate smart lunches
The impact of diet choices on GHG emissions was illustrated through comparing three typical menus during the 5th Global Science Conference on Climate-Smart Agriculture: a high-emissions menu (with beef and lamb), a menu in line with recommendations by the EAT–Lancet Commission (Willett et al., 2019) and a vegetarian lunch. This was organised by a team of research fellows from Climate Food and Farming Global Research Alliance Development Scholarships (CLIFF-GRADS1), and staff of the CGIAR Research Program on Climate Change, Agriculture and Food Security (CCAFS), the Ayana Resort2 restaurant and Wageningen Food & Biobased Research.

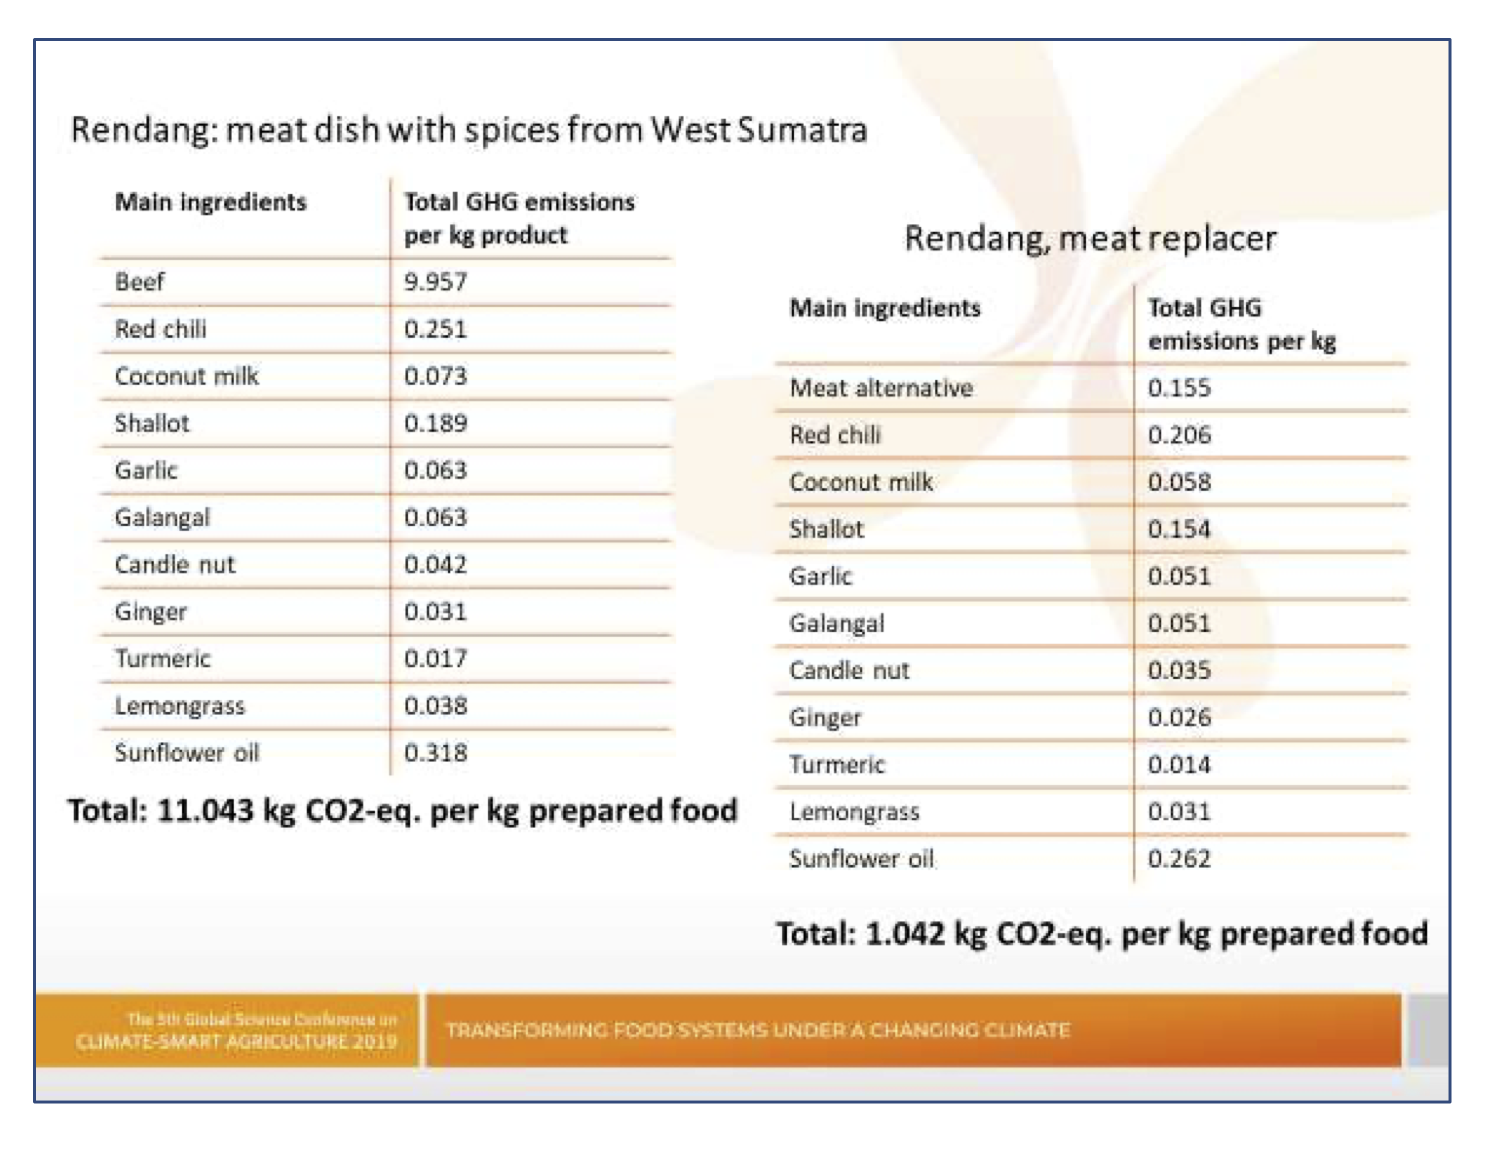
Large variations between GHG emissions of individual items on the menu were found. For example greenhouse gas emissions per serving Rendang, an Indonesian spicy beef dish, was found to be ten times larger than a serving Rendang based on a meat replacer. As Table 1 shows this resulted in large variations of GHG emission per menu type.
1 https://ccafs.cgiar.org/CLIFF-GRADS
2 https://globalcsaconference.org/conference-venue/

See also
https://ccafs.cgiar.org/blog/measuring-climate-impact-our-diet-choices
The ACGE calculator is made available through https://ccafs.cgiar.org.
References
Audsley, E., Brander, M., Chatterton, J., Murphy-Bokern, D., Webster, C., and Williams, A. (2009). How low can we go? An assessment of greenhouse gas emissions from the UK food system and the scope to reduce them by 2050. FCRN-WWF-UK.
Broeze, J. X. Guo, H. Axmann & M. Vollebregt (2019): A systemic approach for trade-off analysis of food loss reduction and greenhouse gas emissions, CCAFS Working Paper.
Clune S, E. Crossin, Verghese K (2017) Systematic review of greenhouse gas emissions for different fresh food categories J Clean Prod 140:766-783
Willett W et al. (2019) Food in the Anthropocene: the EAT–Lancet Commission on healthy diets from sustainable food systems Lancet 393:447–492
WRAP (2010). Understanding consumer use of the freezer. Project code: RBC522- 001.
Acknowledgement
This work was implemented as part of the Consultative Group on International Agricultural Research (CGIAR) Research Program on Climate Change, Agriculture and Food Security (CCAFS), which is carried out with support from CGIAR Fund Donors and through bilateral funding agreements.
For more information, please visit https://ccafs.cgiar.org/donors.
Disclaimer
This Working Paper has been prepared as an output for the Low Emissions Development Flagship/project under the CCAFS program and has not been peer reviewed. Any opinions stated herein are those of the author(s) and do not necessarily reflect the policies or opinions of CCAFS, donor agencies, or partners.
All images remain the sole property of their source and may not be used for any purpose without written permission of the source.
